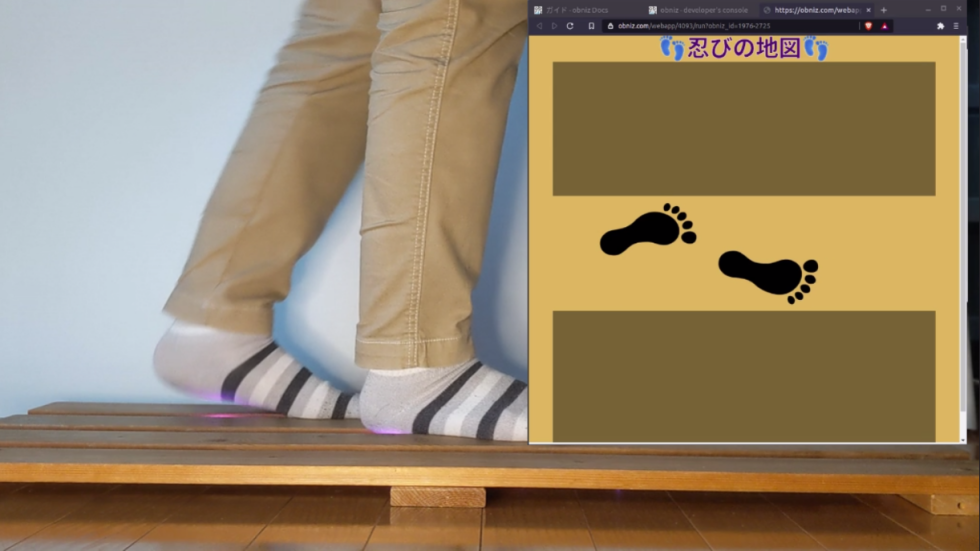
高速な電子機器のリアルタイムモニターは描画が遅れがちで難しいです。この実験ではデータをUARTでobnizに送りjavascriptで描画します。
IoTを使うメリットは
- javascriptの豊富なライブラリを使える
- いろんなディスプレイが使えて便利
デモ動画
ハードウェア
コントローラはセンサーの距離データ合計16個をUARTでobnizに送ります。
ソフトウェア
obniz.html
<html>
<head>
<meta charset="utf-8" />
<meta name="viewport" content="width=device-width, initial-scale=1" />
<link rel="stylesheet" href="https://stackpath.bootstrapcdn.com/bootstrap/4.3.1/css/bootstrap.min.css" />
<script src="https://code.jquery.com/jquery-3.2.1.min.js"></script>
<script src="https://unpkg.com/obniz@3.x/obniz.js" crossorigin="anonymous" ></script>
<script src="https://cdn.plot.ly/plotly-2.0.0.min.js"></script>
</head>
<body>
<div id="obniz-debug"></div>
<h3>START!</h3> <! *** start ***>
<button class="btn btn-primary" id="sw0" style="color:brown;">Switch</button>
<div id="myChart"></div>
<div id='myDiv' style="width:800px;height:800px;"></div>
<script>
const row_len = 2
function getAry8(num) { // [ff,ff,ff,..,ff]
ary = [];
for(let i=0; i<8; i++)
ary.push(num);
return ary;
}
function getTrace(row, rxAry=[]) {
if (rxAry.length == 0)
rxAry = getAry8(255);
else if (row > 0)
rxAry=rxAry.slice(row * 8, (row + 1) * 8)
let trace = {
type: 'scatter3d',
mode : 'markers',
marker: {
color: 'rgb(row * 50, 100, 100)',
size: 6 + row
},
x : [0,1,2,3,4,5,6,7],
y : getAry8(row),
z : rxAry,
opacity: 1,
line: {
width: 6,
reversescale: false
}
};
return trace;
}
let layout = {
scene:{
autosize: true,
camera:{
up:{x: 0, y: 0, z: 1,},
center:{x: 0, y: 0, z: 0,},
eye:{x: 0, y: 1.25, z:0.75,},
},
xaxis: {
nticks: 9,
range: [-1, 8],
},
yaxis: {
nticks: 7,
range: [-1, 2],
},
zaxis: {
nticks: 10,
range: [0, 300],
}
},
};
let RxAry = [];
const mark = 0xff;
function makeRxLst(ary) {
if (ary.length == 0)
return false;
let idx = 0;
if (ary.includes(mark)) {
idx = ary.indexOf(mark) + 1
if (idx > 1)
RxAry.length = 0; // clear array
if (idx == ary.length)
return false;
}
RxAry = RxAry.concat(ary.slice(idx));
// console.log('pos:6', RxAry.toString());
return (RxAry.length >= row_len * 8);
}
// **********************************************************
var obniz = new Obniz("OBNIZ_ID_HERE");
obniz.onconnect = async function() {
let uart = obniz.getFreeUart();
uart.start({ tx: 9, rx: 10, gnd:8, baud:57600});
uart.send("Xyz\n");
Plotly.newPlot('myDiv',[getTrace(0), getTrace(1)],layout);
uart.onreceive = function(data, text){
if (!makeRxLst(data, 2))
return;
// trace.z = RxAry.slice(0, 8 * row_len);
// console.log('pos:7', trace.z.toString());
Plotly.react('myDiv',[getTrace(0, RxAry), getTrace(1, RxAry)],layout);
RxAry.length = 0; // clear array
}
obniz.onloop = async function() {
// obniz.display.print("LED and SW Application")
};
$("#sw0").click(function() {
$("h3").text("SW ONNN!");
});
obniz.onclose = async function() {
uart.end();
};
};
</script>
</body>
</html>描画ライブラリはPlotlyです。フリーで美しいグラフが作れます。
Raspberry_pi_pico.py
from machine import PWM, UART from Sensor_CLED import * def makePwm(gpio, freq, duty16): pwm = PWM(gpio) pwm.freq(freq) pwm.duty_u16(duty16) makePwm(pwmCled_gpio, 50, 1<<15) # set pwm def makeIndi(): val = True def closure(timer): nonlocal val CLed.setIndi(val) val = not val return closure indi = makeIndi() Timer().init(freq=3, mode=Timer.PERIODIC, callback=indi) # *** indicator *** uart = UART(0, baudrate=57600, tx=Pin(16), rx=Pin(17)) def makeFlipFlop(): val = False def closure(timer): nonlocal val val = True def getOn(): nonlocal val rev = val val = False return rev return closure, getOn uaOn, getUaOn = makeFlipFlop() Timer().init(freq=10, mode=Timer.PERIODIC, callback=uaOn) # *** uart for obniz *** # ***************** main ******************** if __name__ == '__main__': cled = CLed() Sensor.init() # *** initialize Sensor *** print('******************* START ********************') cled.turnOn(5) time.sleep(1) while True: Sensor.setAd() cled.turnOn() if getUaOn(): adLst = Sensor.getAdLst(shift = 4) #if sum(adLst)==0: #continue adLst = list(map(lambda x:0xfe - x, adLst)) adLst.insert(0, 0xff) # ff: Start mark uart.write(bytearray(adLst))
uartの送信間隔は100mSです。センサーはもっと速いですがこれ以上速くすると描画遅れが発生します。
1
投稿者の人気記事


-
3duilab
さんが
2021/06/29
に
編集
をしました。
(メッセージ: 初版)
-
3duilab
さんが
2021/06/29
に
編集
をしました。
-
3duilab
さんが
2021/06/29
に
編集
をしました。
-
3duilab
さんが
2021/06/29
に
編集
をしました。
(メッセージ: ここで公開します。)
-
3duilab
さんが
2021/06/29
に
編集
をしました。
-
3duilab
さんが
2021/06/29
に
編集
をしました。
-
3duilab
さんが
2021/06/29
に
編集
をしました。
-
3duilab
さんが
2022/01/18
に
編集
をしました。
-
3duilab
さんが
2022/02/26
に
編集
をしました。
ログインしてコメントを投稿する