
moyashi12e が 2021年05月16日18時27分20秒 に編集
コメント無し
タグの変更
JavaScript
obnizIoTコンテスト
FSR406
本文の変更
# 概要 圧力センサをベッドシーツに配置し、体重負荷によるベット上の動きを取得する。obniz Board 1Yにて、データをクラウド上にアップロードする。そのデータにより間接的な睡眠の管理を行う。 # 背景 コロナ禍の影響により、自宅での高齢者の介護を選択する世帯がある。特に夜中の直接の睡眠の監視は、介護施設においても時間と労力を費やしている。そこで、直接監視ではなくwebやLINEを通した監視・データ蓄積・通知を行うことにより、負担が軽減される。 # 部品 | 物品 | 個数 | |:---:|:---:| | obniz Board 1Y | 1 | | FSR406 | 4 | | 配線ケーブル | 適宜 |
| 電源 | 1個 |
# 回路 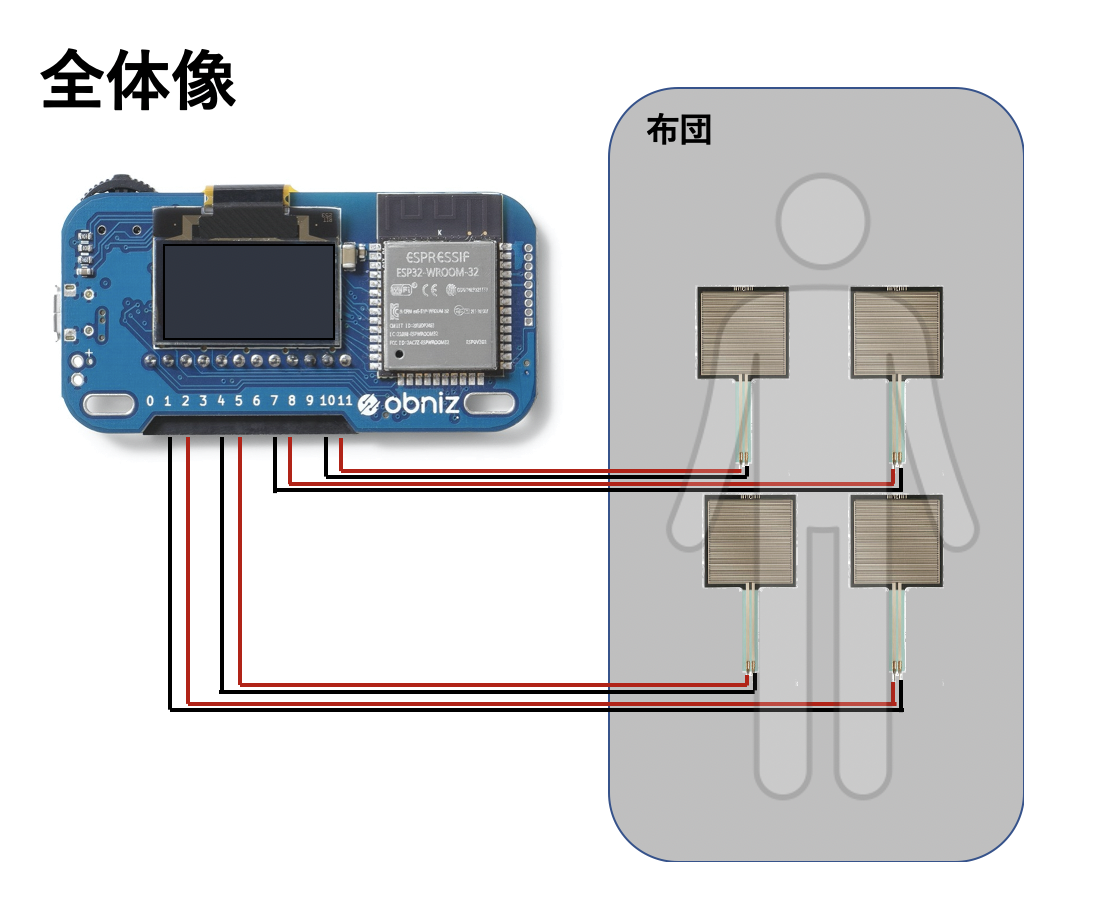 # デモ動画 @[youtube](https://www.youtube.com/watch?v=5JlWu8VWT_A) # コード
アプリ開発>新規作成>テンプレート「温度センサーとグラフ」を基にしたコード。
```
あああ
<html> <head> <meta charset="UTF-8" /> <meta name="viewport" content="width=device-width, initial-scale=1, shrink-to-fit=no" /> <title>Pressure Chart | obniz App</title> <link rel="stylesheet" href="https://stackpath.bootstrapcdn.com/bootstrap/4.3.1/css/bootstrap.min.css" /> <link href="https://use.fontawesome.com/releases/v5.5.0/css/all.css" rel="stylesheet" crossorigin="anonymous" /> <link rel="stylesheet" type="text/css" href="https://obniz.com/css/app-common.css" /> <script src="https://code.jquery.com/jquery-3.2.1.min.js"></script> <script src="https://obniz.com/js/popper-1.12.9/popper.min.js"></script> <script src="https://obniz.com/js/bootstrap-4.0.0/bootstrap.min.js"></script> </head> <body> <script src="https://unpkg.com/obniz@3.x/obniz.js" crossorigin="anonymous" ></script> <script src="https://cdnjs.cloudflare.com/ajax/libs/moment.js/2.8.2/moment.min.js"></script> <script src="https://cdnjs.cloudflare.com/ajax/libs/Chart.js/2.7.2/Chart.min.js"></script> <style> .chart-container { position: relative; margin: 20px auto; max-height: 500px; height: 50vh; width: 100%; } </style> <style> .position-container { position: relative; margin: 20px auto; max-height: 500px; height: 50vh; width: 100%; } </style> <div id="obniz-debug"></div> <!-- Chart --> <div class="container app-content"> <div class="app-content_head"><h1>Position view</h1></div> <input type="button" value="マシンを起動" name="n1" s"> <p name="p1">マシンが停止しています。</p> </div> <div id="Position" style="width: 410px; background-image:url('https://illustimage.com/photo/2239.png'); background-repeat: no-repeat; margin:auto; background-position:center"> <!-- https://nureyon.com/sample/81/body-4-p0.png --> <div style="display:inline-block; width: 410px;height: 205px; margin:auto; text-align: center;padding:0;"> <div id='t-left' style="width: 200px; height: 200px; display: inline-block; background-color:black; margin:auto; padding:0; z-index:-1; opacity:0.1"> </div> <div id='t-right' style="width: 200px; height: 200px; display: inline-block; block; background-color:red; margin:auto; padding:0; z-index:-1;opacity:0.1"> </div> </div> <div style="display:inline-block; width: 410px;height: 205px;margin:auto; text-align: center; padding:0;"> <div id='b-left' style="width: 200px; height: 200px; display: inline-block; background-color:black; margin:auto; padding:0; z-index:-1;opacity:0.1"> </div> <div id='b-right' style="width: 200px; height: 200px; display: inline-block; block; background-color:red; margin:auto; padding:0; z-index:2;opacity:0.1"> </div> </div> </div> </div> </div> </div> </div> <div class="container app-content"> <div class="app-content_head"><h1>Pressure Logger</h1></div> <div class="app-content_body"> <div class="bg-white app-content_body-inner"> <div class="chart-container"> <div class="chartjs-size-monitor" style="position: absolute; left: 0px; top: 0px; right: 0px; bottom: 0px; overflow: hidden; pointer-events: none; visibility: hidden; z-index: -1;" > <div class="chartjs-size-monitor-expand" style="position:absolute;left:0;top:0;right:0;bottom:0;overflow:hidden;pointer-events:none;visibility:hidden;z-index:-1;" > <div style="position:absolute;width:1000000px;height:1000000px;left:0;top:0" ></div> </div> <div class="chartjs-size-monitor-shrink" style="position:absolute;left:0;top:0;right:0;bottom:0;overflow:hidden;pointer-events:none;visibility:hidden;z-index:-1;" > <div style="position:absolute;width:200%;height:200%;left:0; top:0" ></div> </div> </div> <canvas id="myChart" style="width: 100%; height: 100%; display: block;" class="chartjs-render-monitor" ></canvas> </div> <script> const button = document.querySelector('input[name="n1"]'); const paragraph = document.querySelector('p[name="p1"]'); window.onload = function () { button.addEventListener('click', updateButton); function updateButton() { if (button.value === 'マシンを起動') { button.value = 'マシンを停止'; paragraph.textContent = 'マシンが起動しています!'; document.getElementById('t-left').style.backgroundColor = 'skyblue'; document.getElementById('t-right').style.backgroundColor = 'blue'; document.getElementById('b-left').style.backgroundColor = 'blue'; document.getElementById('b-right').style.backgroundColor = 'skyblue'; } else { button.value = 'マシンを起動'; paragraph.textContent = 'マシンが停止しています。'; document.getElementById('t-left').style.backgroundColor = 'blue'; document.getElementById('t-right').style.backgroundColor = 'skyblue'; document.getElementById('b-left').style.backgroundColor = 'skyblue'; document.getElementById('b-right').style.backgroundColor = 'blue'; } } }; </script> <script> //------- let myChart; let myPosition; var pressure,pressure0,pressure4 // OBNIZ_ID_HERE will be replaced at run. // インストールされたデバイス情報に書き換わる var obniz = new Obniz("OBNIZ_ID_HERE"); // Called on Online // 接続時に呼ばれる。 obniz.onconnect = async function () { pressure1 = obniz.wired("FSR40X", { pin0: 1, pin1: 2 }); pressure4 = obniz.wired("FSR40X", { pin0: 4, pin1: 5 }); pressure7 = obniz.wired("FSR40X", { pin0: 7, pin1: 8 }); pressure10 = obniz.wired("FSR40X", { pin0: 10, pin1: 11 }); function updatePosition_TopRight(press) { if (press >300) {document.getElementById('t-right').style.backgroundColor = 'blue';} else {document.getElementById('t-right').style.backgroundColor = 'skyblue';} } function updatePosition_TopLeft(press) { if (press >300) {document.getElementById('t-left').style.backgroundColor = 'blue';} else {document.getElementById('t-left').style.backgroundColor = 'skyblue';} } function updatePosition_BottomRight(press) { if (press >300) {document.getElementById('b-right').style.backgroundColor = 'blue';} else {document.getElementById('b-right').style.backgroundColor = 'skyblue';} } function updatePosition_BottomLeft(press) { if (press >300) {document.getElementById('b-left').style.backgroundColor = 'blue';} else {document.getElementById('b-left').style.backgroundColor = 'skyblue';} } // Called repeatedly while online // obnizがオンラインである限り繰り返し呼ばれる。 obniz.onloop = async function () { // Getting a Pressure await obniz.wait(1000); var press1 = await pressure1.getWait(); var press4 = await pressure4.getWait(); var press7 = await pressure7.getWait(); var press10 = await pressure10.getWait(); // Draw it on chart addChart(press1,press4,press7,press10); scrollToRight(); myChart.update(); updatePosition_TopLeft(press1) updatePosition_TopRight(press4) updatePosition_BottomLeft(press7) updatePosition_BottomRight(press10) await obniz.wait(1000/2); }; }; // Called on Offline // 切断時に呼ばれる obniz.disconnect = async function () { pressure1,pressure4,pressure7,pressure10 = null; }; // drawing function. function setupCharts() { let ctx = document.getElementById("myChart").getContext("2d"); let dataSet = [ { label: "pressure1", data: [], borderWidth: 10, fill: false, lineTension: 0, borderColor: "rgb(252,109,83)", backgroundColor: "rgb(252,109,83)", }, { label: "pressure4", data: [], borderWidth: 10, fill: false, lineTension: 0, borderColor: "rgb(0,109,83)", backgroundColor: "rgb(0,109,83)", }, { label: "pressure7", data: [], borderWidth: 10, fill: false, lineTension: 0, borderColor: "rgb(0,0,83)", backgroundColor: "rgb(0,0,83)", }, { label: "pressure10", data: [], borderWidth: 10, fill: false, lineTension: 0, borderColor: "rgb(200,100,8)", backgroundColor: "rgb(200,100,8)", }, ]; myChart = new Chart(ctx, { type: "line", data: { datasets: dataSet, }, options: { animation: { duration: 0, }, legend: { display: false, }, scales: { xAxes: [ { type: "time", time: {}, scaleLabel: { display: true, position: "left", labelString: "Time", }, }, ], yAxes: [ { scaleLabel: { display: true, labelString: "Pressure", fontColor: "rgb(252,109,83)", }, ticks: { suggestedMin: 20, suggestedMax: 500, }, }, ], }, }, }); } function addChart(press0,press2,press4,press6) { myChart.data.datasets[0].data.push({ x: new Date(), y: press1 }); myChart.data.datasets[1].data.push({ x: new Date(), y: press4 }); myChart.data.datasets[2].data.push({ x: new Date(), y: press7 }); myChart.data.datasets[3].data.push({ x: new Date(), y: press10 }); } function scrollToRight() { let now = new Date(); myChart.options.scales.xAxes[0].time.max = now; myChart.options.scales.xAxes[0].time.min = new Date( now.getTime() - 60 * 1000 ); for (let i = 0; i < myChart.data.datasets.length; i++) { myChart.data.datasets[i].data = myChart.data.datasets[i].data.filter( (elm) => { return elm.x.getTime() > myChart.options.scales.xAxes[0].time.min; } ); } } setupCharts(); //------------------------- </script> </div> </div> </div> </body> </html>
```
# 【展開】 以下のような追加機能も検討している。
# あとがき テンプレートの活用により、webページとの連携がスムーズに行えた。 このボードを使うことで、IoT初心者も欲しいものを簡単に作れるようになるように感じた。 今後は、これらの機能も追加して、実用性も上げる。
・LINEでの通知機能 ・押しボタンスイッチによる「呼び機能」
・テンプレ「io0スリープ機能」
・スマートウォッチのAPIを用いた心拍管理