


圧力センサを用いた睡眠モニタリング
- FSR406
- JavaScript
- obnizBoard1Y
- obnizIoTコンテスト
 obniz IoT コンテスト 2021
概要
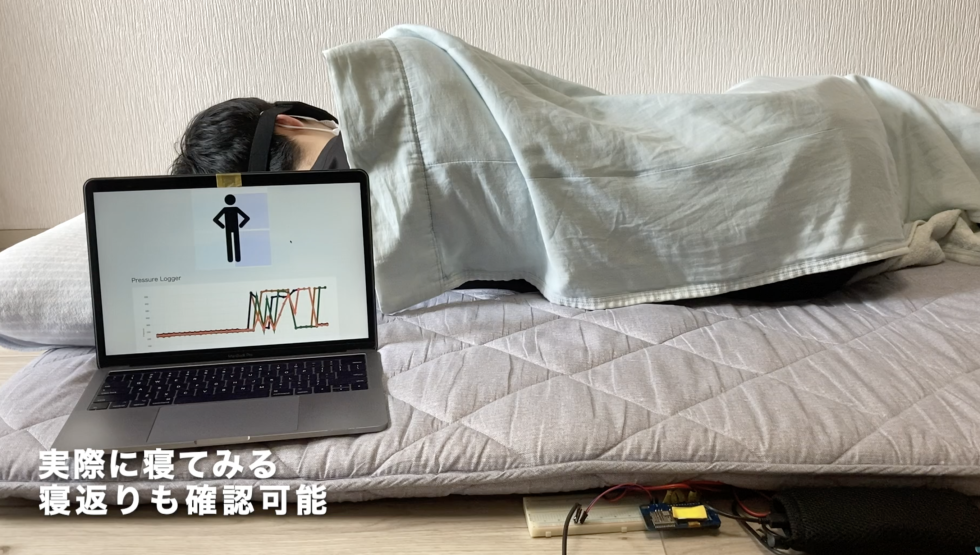
圧力センサを布団の下に配置し、体重負荷によるベット上の体の動きを取得する。obniz Board 1Yにて、データをwebに出力し睡眠モニタリングを行う。
背景
コロナ禍の影響により、自宅での高齢者の介護を選択する世帯がある。私の実家がその一つである。特に夜中の直接の睡眠の監視は、介護施設においても時間と労力を費やす。そこで、直接監視ではなくwebやLINEを通した監視・データ蓄積・通知を行うことにより、介護の負担を軽減することができる。
部品
| 物品 | 個数 |
|---|---|
| obniz Board 1Y | 1 |
| FSR406 | 4 |
| 配線ケーブル | 適宜 |
| 電源 | 1個 |
回路
デモ動画
コード
アプリ開発>新規作成>テンプレート「温度センサーとグラフ」を基にしたコード。
<html>
  <head>
    <meta charset="UTF-8" />
    <meta
      name="viewport"
      content="width=device-width, initial-scale=1, shrink-to-fit=no"
    />
    <title>Pressure Chart | obniz App</title>
    <link
      rel="stylesheet"
      href="https://stackpath.bootstrapcdn.com/bootstrap/4.3.1/css/bootstrap.min.css"
    />
    <link
      href="https://use.fontawesome.com/releases/v5.5.0/css/all.css"
      rel="stylesheet"
      crossorigin="anonymous"
    />
    <link
      rel="stylesheet"
      type="text/css"
      href="https://obniz.com/css/app-common.css"
    />
    <script src="https://code.jquery.com/jquery-3.2.1.min.js"></script>
    <script src="https://obniz.com/js/popper-1.12.9/popper.min.js"></script>
    <script src="https://obniz.com/js/bootstrap-4.0.0/bootstrap.min.js"></script>
  </head>
  <body>
    <script
      src="https://unpkg.com/obniz@3.x/obniz.js"
      crossorigin="anonymous"
    ></script>
    <script src="https://cdnjs.cloudflare.com/ajax/libs/moment.js/2.8.2/moment.min.js"></script>
    <script src="https://cdnjs.cloudflare.com/ajax/libs/Chart.js/2.7.2/Chart.min.js"></script>
    <style>
      .chart-container {    position: relative;    margin: 20px auto;    max-height: 500px;    height: 50vh;    width: 100%;  }
    </style>
    <style>
      .position-container {    position: relative;    margin: 20px auto;    max-height: 500px;    height: 50vh;    width: 100%;  }
    </style>
    <div id="obniz-debug"></div>
    <!-- Chart -->
    <div class="container app-content">
      <div class="app-content_head"><h1>Position view</h1></div>
      <input type="button" value="マシンを起動" name="n1" s">
      <p name="p1">マシンが停止しています。</p>
     </div>


            <div id="Position" style="width: 410px;  background-image:url('https://illustimage.com/photo/2239.png'); background-repeat: no-repeat; margin:auto;  background-position:center">
            <!-- https://nureyon.com/sample/81/body-4-p0.png -->
         <div style="display:inline-block; width: 410px;height: 205px;  margin:auto; text-align: center;padding:0;">

              <div id='t-left' style="width: 200px; height: 200px; display: inline-block; background-color:black; margin:auto; padding:0; z-index:-1; opacity:0.1">
                 </div>
               <div id='t-right' style="width: 200px; height: 200px; display: inline-block; block; background-color:red; margin:auto; padding:0; z-index:-1;opacity:0.1">
                 </div>
              </div>

         <div style="display:inline-block;  width: 410px;height: 205px;margin:auto; text-align: center; padding:0;">

              <div id='b-left' style="width: 200px; height: 200px; display: inline-block; background-color:black; margin:auto; padding:0; z-index:-1;opacity:0.1">
                 </div>
               <div id='b-right' style="width: 200px; height: 200px; display: inline-block; block; background-color:red; margin:auto; padding:0; z-index:2;opacity:0.1">
                 </div>
              </div>


            </div>


          </div>
        </div>
      </div>
    </div>


    <div class="container app-content">
      <div class="app-content_head"><h1>Pressure Logger</h1></div>
      <div class="app-content_body">
        <div class="bg-white app-content_body-inner">
          <div class="chart-container">
            <div
              class="chartjs-size-monitor"
              style="position: absolute; left: 0px; top: 0px; right: 0px; bottom: 0px; overflow: hidden; pointer-events: none; visibility: hidden; z-index: -1;"
            >
              <div
                class="chartjs-size-monitor-expand"
                style="position:absolute;left:0;top:0;right:0;bottom:0;overflow:hidden;pointer-events:none;visibility:hidden;z-index:-1;"
              >
                <div
                  style="position:absolute;width:1000000px;height:1000000px;left:0;top:0"
                ></div>
              </div>
              <div
                class="chartjs-size-monitor-shrink"
                style="position:absolute;left:0;top:0;right:0;bottom:0;overflow:hidden;pointer-events:none;visibility:hidden;z-index:-1;"
              >
                <div
                  style="position:absolute;width:200%;height:200%;left:0; top:0"
                ></div>
              </div>
            </div>
            <canvas
              id="myChart"
              style="width: 100%; height: 100%; display: block;"
              class="chartjs-render-monitor"
            ></canvas>
          </div>


<script>
const button = document.querySelector('input[name="n1"]');
const paragraph = document.querySelector('p[name="p1"]');

window.onload = function () {
button.addEventListener('click', updateButton);

function updateButton() {
  if (button.value === 'マシンを起動') {
    button.value = 'マシンを停止';
    paragraph.textContent = 'マシンが起動しています!';
    document.getElementById('t-left').style.backgroundColor = 'skyblue';
    document.getElementById('t-right').style.backgroundColor = 'blue';
    document.getElementById('b-left').style.backgroundColor = 'blue';
    document.getElementById('b-right').style.backgroundColor = 'skyblue';


  } else {
    button.value = 'マシンを起動';
    paragraph.textContent = 'マシンが停止しています。';
    document.getElementById('t-left').style.backgroundColor = 'blue';
    document.getElementById('t-right').style.backgroundColor = 'skyblue';
    document.getElementById('b-left').style.backgroundColor = 'skyblue';
    document.getElementById('b-right').style.backgroundColor = 'blue';

  }
}
 };
</script>


<script>

//-------
 let myChart;
 let myPosition;
 var pressure,pressure0,pressure4

 // OBNIZ_ID_HERE will be replaced at run.
 // インストールされたデバイス情報に書き換わる
 var obniz = new Obniz("OBNIZ_ID_HERE");

 // Called on Online
 // 接続時に呼ばれる。
 obniz.onconnect = async function () {

   pressure1 = obniz.wired("FSR40X", { pin0: 1, pin1: 2 });
   pressure4 = obniz.wired("FSR40X", { pin0: 4, pin1: 5 });
   pressure7 = obniz.wired("FSR40X", { pin0: 7, pin1: 8 });
  pressure10 = obniz.wired("FSR40X", { pin0: 10, pin1: 11 });


   function updatePosition_TopRight(press) {
  if (press >300) {document.getElementById('t-right').style.backgroundColor = 'blue';}
  else {document.getElementById('t-right').style.backgroundColor = 'skyblue';}
}
   function updatePosition_TopLeft(press) {
  if (press >300) {document.getElementById('t-left').style.backgroundColor = 'blue';}
  else {document.getElementById('t-left').style.backgroundColor = 'skyblue';}
}
   function updatePosition_BottomRight(press) {
  if (press >300) {document.getElementById('b-right').style.backgroundColor = 'blue';}
  else {document.getElementById('b-right').style.backgroundColor = 'skyblue';}
}
   function updatePosition_BottomLeft(press) {
  if (press >300) {document.getElementById('b-left').style.backgroundColor = 'blue';}
  else {document.getElementById('b-left').style.backgroundColor = 'skyblue';}
}


 // Called repeatedly while online
 // obnizがオンラインである限り繰り返し呼ばれる。
 obniz.onloop = async function () {
   // Getting a Pressure
    await obniz.wait(1000);
   var press1 = await pressure1.getWait();
   var press4 = await pressure4.getWait();
   var press7 = await pressure7.getWait();
   var press10 = await pressure10.getWait();


   // Draw it on chart
   addChart(press1,press4,press7,press10);
   scrollToRight();
   myChart.update();
   updatePosition_TopLeft(press1)
   updatePosition_TopRight(press4)
   updatePosition_BottomLeft(press7)
   updatePosition_BottomRight(press10)


   await obniz.wait(1000/2);
 };

 };

 // Called on Offline
 // 切断時に呼ばれる
 obniz.disconnect = async function () {
   pressure1,pressure4,pressure7,pressure10 = null;
 };


 // drawing function.
 function setupCharts() {
   let ctx = document.getElementById("myChart").getContext("2d");

   let dataSet = [
     {
       label: "pressure1",
       data: [],
       borderWidth: 10,
       fill: false,
       lineTension: 0,
       borderColor: "rgb(252,109,83)",
       backgroundColor: "rgb(252,109,83)",
     },
          {
       label: "pressure4",
       data: [],
       borderWidth: 10,
       fill: false,
       lineTension: 0,
       borderColor: "rgb(0,109,83)",
       backgroundColor: "rgb(0,109,83)",
     },
               {
       label: "pressure7",
       data: [],
       borderWidth: 10,
       fill: false,
       lineTension: 0,
       borderColor: "rgb(0,0,83)",
       backgroundColor: "rgb(0,0,83)",
     },               {
       label: "pressure10",
       data: [],
       borderWidth: 10,
       fill: false,
       lineTension: 0,
       borderColor: "rgb(200,100,8)",
       backgroundColor: "rgb(200,100,8)",
     },
   ];

   myChart = new Chart(ctx, {
     type: "line",
     data: {
       datasets: dataSet,
     },
     options: {
       animation: {
         duration: 0,
       },
       legend: {
         display: false,
       },
       scales: {
         xAxes: [
           {
             type: "time",
             time: {},
             scaleLabel: {
               display: true,
               position: "left",
               labelString: "Time",
             },
           },
         ],
         yAxes: [
           {
             scaleLabel: {
               display: true,
               labelString: "Pressure",
               fontColor: "rgb(252,109,83)",
             },
             ticks: {
               suggestedMin: 20,
               suggestedMax: 500,
             },
           },
         ],
       },
     },
   });
 }

 function addChart(press0,press2,press4,press6) {
   myChart.data.datasets[0].data.push({ x: new Date(), y: press1 });
   myChart.data.datasets[1].data.push({ x: new Date(), y: press4 });
   myChart.data.datasets[2].data.push({ x: new Date(), y: press7 });
   myChart.data.datasets[3].data.push({ x: new Date(), y: press10 });

 }

 function scrollToRight() {
   let now = new Date();
   myChart.options.scales.xAxes[0].time.max = now;
   myChart.options.scales.xAxes[0].time.min = new Date(
     now.getTime() - 60 * 1000
   );
   for (let i = 0; i < myChart.data.datasets.length; i++) {
     myChart.data.datasets[i].data = myChart.data.datasets[i].data.filter(
       (elm) => {
         return elm.x.getTime() > myChart.options.scales.xAxes[0].time.min;
       }
     );
   }
 }

 setupCharts();


 //-------------------------


</script>
        </div>
      </div>
    </div>
  </body>
</html>
あとがき
テンプレートの活用により、webページとの連携がスムーズに行えた。
このボードを使うことで、IoT初心者も欲しいものを簡単に作れるようになるように感じた。
今後は、これらの機能も追加して、実用性も上げる。
・LINEでの通知機能
・押しボタンスイッチによる「呼び機能」
・テンプレ「io0スリープ機能」
・スマートウォッチのAPIを用いた心拍管理

-
moyashi12e
さんが
2021/05/09
に
編集
をしました。
(メッセージ: 初版)
-
moyashi12e
さんが
2021/05/09
に
編集
をしました。
-
moyashi12e
さんが
2021/05/16
に
編集
をしました。
-
moyashi12e
さんが
2021/05/16
に
編集
をしました。
-
moyashi12e
さんが
2021/05/16
に
編集
をしました。
-
moyashi12e
さんが
2021/05/16
に
編集
をしました。
-
moyashi12e
さんが
2021/05/16
に
編集
をしました。
-
moyashi12e
さんが
2021/05/16
に
編集
をしました。
ログインしてコメントを投稿する